CGIAR-CSI SRTM Frequently Asked Questions (FAQ)
- What is the source of this data, and why is it different from the NASA data?
- What formats are available?
- What is the mask data?
- When I import GeoTIFF data, values of –32768 appear. What does this mean?
- Why do some mountain regions have peaks significantly lower than they should be?
- Why do some small islands not appear in the dataset?
- Why do some regions have very smooth looking topography?
- When is the next update likely to be available, and what modifications are expected?
- Can I use this data for commercial use?
- What is the point of origin and placement of a pixel in the dataset?
What is the source of this data, and why is it different from the NASA data?
The current dataset (Version 4) has been produced based on the finished-grade 3 arc-second SRTM data released by NASA and distributed by the USGS through ftp access (ftp://edcsgs9.cr.usgs.gov/pub/data/srtm/version1/). The original data came with data voids, where insufficient contrast was available in the radar data to extract the elevation. These data voids tend to occur over water bodies (lakes and rivers), areas with snow cover and in mountainous regions (for example, the Himalayas has the greatest concentration of no data voids in the original data). The CGIAR-CSI SRTM dataset has undergone post-processing of the NASA data to “fill in” the no data voids through interpolation techniques (see the Data Processing and Methodology page for detailed description). The result is seamless, complete coverage of elevation for the globe.
Back to top
What formats are available?
The data comes in two formats: arc-formatted ASCII and GeoTIFF.
Arc ASCII: This is a text-based data array, with a five-line header providing the information on spatial extent and resolution.The coordinates in the header represent the lower left corner of the lower left pixel. No data values are represented by values of –9999.
This data can be imported into ArcView 3.2 through use of the Spatial Analysis extension and File->Import Data Source.
Within ArcGIS, there are different methods available for importing ASCII files. You can access toolboxes from the ArcToolbox window or the ArcCatalog tree. The Conversion toolbox contains tools that convert data between various formats. Select Ascii to raster. Next a dialog box appears where you supply the parameter values for the tool, then click OK. Alternatively, the command line syntax is:
ASCIIToRaster_conversion {INTEGER | FLOAT}
Many other GIS software can read ARC ASCIIs through import functions.
GeoTIFF: The GeoTiff data are georeferenced images (with the geographic data embedded – there is no .gtif file) in signed 16 bit (-32768 to 32767) TIF format. They have been produced through export from ArcGIS 8. In the GeoTIFF files, values of –32768 represent no data regions.
Back to top
What is the mask data?
The mask data is also available on the web site. This represents grids of 1’s and no data values (-32768 for some programs, -9999 in the ASCIIs) showing the areas where the original data came with data voids. The areas with values of 1 in the mask data have been subjected to the interpolation technique, and therefore contain interpolated elevation values NOT available originally in the NASA release of the SRTM data. The error margin within these original data void areas should be expected to be greater.
Back to top
When I import GeoTIFF data, values of –32768 appear. What does this mean?
When the GeoTiff files are imported into some software programs, it has been reported that values of –32768 result. This is due to the software failing to identify values of –32768 as pixels with no data. Users can either search for a solution that fixes this or should explore the ASCII files that so far have not presented any similar problems.
This problem can be solved by reclassifying (reclassifying –32768 as NO DATA) or querying all pixels with values greater than –32768, and recalculating the grid based only on those regions. One command in Arc/Info can also solve this (the user should specify the name of the grid for “outgrid” and “srtmdem”)::
OUTGRID = setnull(SRTMDEM == -32768, SRTMDEM)
Back to top
Why do some mountain regions have peaks significantly lower than they should be?
As mentioned earlier, many original data voids are concentrated in mountainous areas and in snow-covered regions. Hence, many peaks in high-mountain areas are actually interpolated. Without using a high resolution co-variable for the interpolation, the interpolation fails to identify that the data void is actually a peak, and tends to “flatten” the peak, leading to underestimates in the true elevation for that region. This issue is largely resolved in Version 4.
Back to top
Why do some small islands not appear in the dataset?
The dataset available online has been cut for shorelines using the Shorelines and Water Bodies dataset (SWBD) that accompanies SRTM topography data. In some cases this dataset fails to include small islands. The result is that these small islands, originally captured in the SRTM data, are lost from the dataset during the cutting process with shorelines. Uncut data is available upon request – this includes large areas of radar backscatter over water bodies.
Back to top
Why do some regions have very smooth looking topography?
Interpolated regions in the dataset can often be spotted as they appear to be very smooth, visibly lacking low-scale detail. These are the areas with original no data voids, that have undergone interpolation.
Back to top
When is the next update likely to be available, and what modifications are expected?
The current release is Version 4. It is envisaged that CGIAR-CSI SRTM Version 4 is our definitive and final release of the 3-arc-second product. However, we do plan some improvements which will be updated as patches. These will include areas where new high-resolution DEMs become available for the interpolation of holes. This may include the use of ASTER scenes to fill holes.
Back to top
Can I use this data for commercial use?
If interested in using this data for commercial purposes please email Andy Jarvis.
Back to top
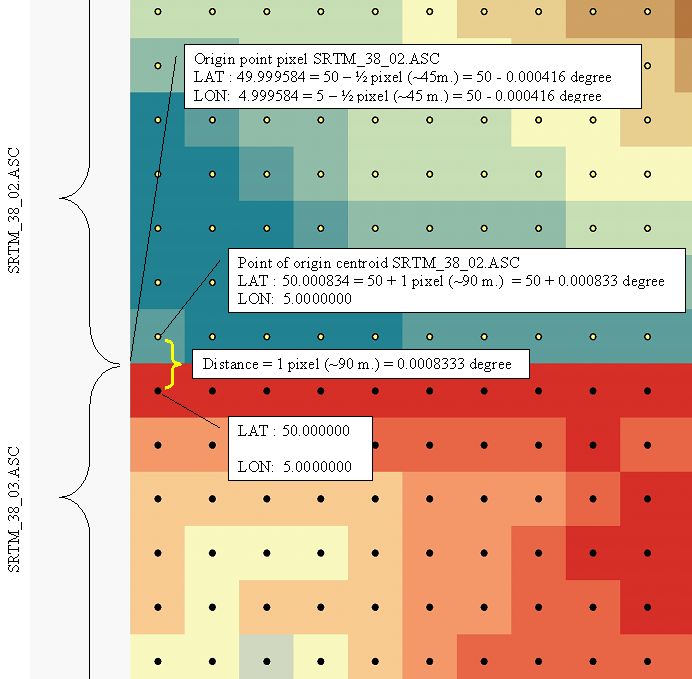
What is the point of origin and placement of a pixel in the dataset?
The below diagram shows how an example SRTM tile should be read. This is an example for SRTM_38_03 and SRTM_38_02.